

Guest Editorial by Tom V. Segalstad on CO2 Science
In a paper recently published in the international peer-reviewed journal Energy & Fuels, Dr. Robert H. Essenhigh (2009), Professor of Energy Conversion at The Ohio State University, addresses the residence time (RT) of anthropogenic CO2 in the air. He finds that the RT for bulk atmospheric CO2, the molecule 12CO2, is ~5 years, in good agreement with other cited sources (Segalstad, 1998), while the RT for the trace molecule 14CO2 is ~16 years. Both of these residence times are much shorter than what is claimed by the IPCC. The rising concentration of atmospheric CO2 in the last century is not consistent with supply from anthropogenic sources. Such anthropogenic sources account for less than 5% of the present atmosphere, compared to the major input/output from natural sources (~95%). Hence, anthropogenic CO2 is too small to be a significant or relevant factor in the global warming process, particularly when comparing with the far more potent greenhouse gas water vapor. The rising atmospheric CO2 is the outcome of rising temperature rather than vice versa. Correspondingly, Dr. Essenhigh concludes that the politically driven target of capture and sequestration of carbon from combustion sources would be a major and pointless waste of physical and financial resources.
Essenhigh (2009) points out that the IPCC (Intergovernmental Panel on Climate Change) in their first report (Houghton et al., 1990) gives an atmospheric CO2 residence time (lifetime) of 50-200 years [as a “rough estimate"]. This estimate is confusingly given as an adjustment time for a scenario with a given anthropogenic CO2 input, and ignores natural (sea and vegetation) CO2 flux rates. Such estimates are analytically invalid; and they are in conflict with the more correct explanation given elsewhere in the same IPCC report: “This means that on average it takes only a few years before a CO2 molecule in the atmosphere is taken up by plants or dissolved in the ocean”.
Some 99% of the atmospheric CO2 molecules are 12CO2 molecules containing the stable isotope 12C (Segalstad, 1982). To calculate the RT of the bulk atmospheric CO2 molecule 12CO2, Essenhigh (2009) uses the IPCC data of 1990 with a total mass of carbon of 750 gigatons in the atmospheric CO2 and a natural input/output exchange rate of 150 gigatons of carbon per year (Houghton et al., 1990). The characteristic decay time (denoted by the Greek letter tau) is simply the former value divided by the latter value: 750 / 150 = 5 years. This is a similar value to the ~5 years found from 13C/12C carbon isotope mass balance calculations of measured atmospheric CO2 13C/12C carbon isotope data by Segalstad (1992); the ~5 years obtained from CO2 solubility data by Murray (1992); and the ~5 years derived from CO2 chemical kinetic data by Stumm & Morgan (1970).
Revelle & Suess (1957) calculated from data for the trace atmospheric molecule 14CO2, containing the radioactive isotope14C, that the amount of atmospheric “CO2 derived from industrial fuel combustion” would be only 1.2% for an atmospheric CO2 lifetime of 5 years, and 1.73% for a CO2 lifetime of 7 years (Segalstad, 1998). Essenhigh (2009) reviews measurements of 14C from 1963 up to 1995, and finds that the RT of atmospheric 14CO2 is ~16 (16.3) years. He also uses the 14C data to find that the time value (exchange time) for variation of the concentration difference between the northern and southern hemispheres is ~2 (2.2) years for atmospheric 14CO2. This result compares well with the observed hemispheric transport of volcanic debris leading to “the year without a summer” in 1816 in the northern hemisphere after the 1815 Tambora volcano cataclysmic eruption in Indonesia in 1815.
Sundquist (1985) compiled a large number of measured RTs of CO2 found by different methods. The list, containing RTs for both 12CO2 and 14CO2, was expanded by Segalstad (1998), showing a total range for all reported RTs from 1 to 15 years, with most RT values ranging from 5 to 15 years. Essenhigh (2009) emphasizes that this list of measured values of RT compares well with his calculated RT of 5 years (atmospheric bulk 12CO2) and ~16 years (atmospheric trace 14CO2). Furthermore he points out that the annual oscillations in the measured atmospheric CO2 levels would be impossible without a short atmospheric residence time for the CO2 molecules.
Essenhigh (2009) suggests that the difference in atmospheric CO2 residence times between the gaseous molecules 12CO2 and 14CO2 may be due to differences in the kinetic absorption and/or dissolution rates of the two different gas molecules.
With such short residence times for atmospheric CO2, Essenhigh (2009) correctly points out that it is impossible for the anthropogenic combustion supply of CO2 to cause the given rise in atmospheric CO2. Consequently, a rising atmospheric CO2 concentration must be natural. This conclusion accords with measurements of 13C/12C carbon isotopes in atmospheric CO2, which show a maximum of 4% anthropogenic CO2 in the atmosphere (including any biogenic CO2), with 96% of the atmospheric CO2 being isotopically indistinguishable from “natural” inorganic CO2 exchanged with and degassed from the ocean, and degassed from volcanoes and the Earth’s interior (Segalstad, 1992).
Essenhigh (2009) discusses alternative ways of expressing residence time, like fill time, decay time, e-fold time, turnover time, lifetime, and so on, and whether the Earth system carbon cycle is in dynamic equilibrium or non-equilibrium status. He concludes (like Segalstad, 1998) that the residence time is a robust parameter independent of the status of equilibrium, and that alternative expressions of the residence time give corresponding values.
It is important to compare Essenhigh’s (2009) results with a recently published paper in PNAS by Solomon et al. (2009), the first author of which (Susan Solomon) co-chairs the IPCC Working Group One, the part of the IPCC that deals with physical climate science. This paper was published after Essenhigh had submitted his manuscript to Energy & Fuels.
The message of Solomon et al. (2009) is that there is an irreversible climate change due to the assimilation of CO2 in the atmosphere, solely due to anthropogenic CO2 emissions. From quantified scenarios of anthropogenic increases in atmospheric CO2, their implication is that the CO2 level flattens out asymptotically towards infinity, giving a residence time of more than 1000 years (without offering a definition or discussion of residence time or isotopic differences): “a quasi-equilibrium amount of CO2 is expected to be retained in the atmosphere by the end of the millennium that is surprisingly large: typically ~40% of the peak concentration enhancement over preindustrial values (~280 ppmv)”. The authors’ Fig. 1, i.a. shows a peak level at 1200 ppmv atmospheric CO2 in the year 2100, levelling off to an almost steady level of ~800 ppmv in the year 3000. It is not known how their 40% estimate was derived.
Solomon et al. (2009) go on to say that “this can be easily understood on the basis of the observed instantaneous airborne fraction (AFpeak) of ~50% of anthropogenic carbon emissions retained during their build-up in the atmosphere, together with well-established ocean chemistry and physics that require ~20% of the emitted carbon to remain in the atmosphere on thousand-year timescales [quasi-equilibrium airborne fraction (AFequil), determined largely by the Revelle factor governing the long-term partitioning of carbon between the ocean and atmosphere/biosphere system]”.
Solomon et al. (2009) have obviously not seriously considered the paper by Segalstad (1998), who addresses the 50% “missing sink” error of the IPCC and shows that the Revelle evasion “buffer” factor is ideologically defined from an assumed model (atmospheric anthropogenic CO2 increase) and an assumed pre-industrial value for the CO2 level, in conflict with the chemical Henry’s Law governing the fast ~1:50 equilibrium partitioning of CO2 between gas (air) and fluid (ocean) at the Earth’s average surface temperature. This CO2 partitioning factor is strongly dependent on temperature because of the temperature-dependent retrograde aqueous solubility of CO2, which facilitates fast degassing of dissolved CO2 from a heated fluid phase (ocean), similar to what we experience from a heated carbonated drink.
Consequently, the IPCC’s and Solomon et al.’s (2009) non-realistic carbon cycle modelling and misconception of the way the geochemistry of CO2 works simply defy reality, and would make it impossible for breweries to make the carbonated beer or soda “pop” that many of us enjoy (Segalstad, 1998).
So why is the correct estimate of the atmospheric residence time of CO2 so important? The IPCC has constructed an artificial model where they claim that the natural CO2 input/output is in static balance, and that all CO2 additions from anthropogenic carbon combustion being added to the atmospheric pool will stay there almost indefinitely. This means that with an anthropogenic atmospheric CO2 residence time of 50 - 200 years (Houghton, 1990) or near infinite (Solomon et al., 2009), there is still a 50% error (nicknamed the “missing sink") in the IPCC’s model, because the measured rise in the atmospheric CO2 level is just half of that expected from the amount of anthropogenic CO2 supplied to the atmosphere; and carbon isotope measurements invalidate the IPCC’s model (Segalstad, 1992; Segalstad, 1998).
The correct evaluation of the CO2 residence time—giving values of about 5 years for the bulk of the atmospheric CO2 molecules, as per Essenhigh’s (2009) reasoning and numerous measurements with different methods—tells us that the real world’s CO2 is part of a dynamic (i.e. non-static) system, where about one fifth of the atmospheric CO2 pool is exchanged every year between different sources and sinks, due to relatively fast equilibria and temperature-dependent CO2 partitioning governed by the chemical Henry’s Law (Segalstad 1992; Segalstad, 1996; Segalstad, 1998).
Knowledge of the correct timing of the whereabouts of CO2 in the air is essential to a correct understanding of the way nature works and the extent of anthropogenic modulation of, or impact upon, natural processes. Concerning the Earth’s carbon cycle, the anthropogenic contribution and its influence are so small and negligible that our resources would be much better spent on other real challenges that are facing mankind.
Tom V, Segalstad is an Associate Professor of Resource and Environmental Geology, The University of Oslo, Norway
By Joseph D’Aleo
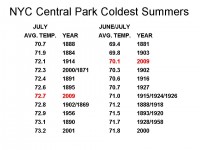
Many cities in the east and central reported the coldest July on record and some cities a top 5 coolest June and July period. Here is one of the latter - New York City’s Central Park.
With an average daily temperature of 72.7...3.8 degrees below normal… This is the sixth coolest July on record at Central Park.
Daily average temperatures have been at or below normal every day but two this month (the 28th and 30th)...for 46 of 48 days dating back to June 13th...and for 54 of the 60 days since June 1st.
Central Park has had only one day reach above 85 degrees so far this summer (86 on July 17th). This is the fewest number of days above 85 on record at Central Park since records began being taken in 1869. The old record was 7 in 1996.
Central Park has yet to reach 90 degrees this summer...for only the second time on record. The only other year not to have at least one 90 degree day in June or July was 1996.
For the months of June and July...the average temperature in 2009 is 70.1 degrees, making this the third coolest June and July on record in 151 years at Central Park. See story NWS here and NY Times here.
Larger image here.
It is also the second wettest June and July on record and on track to become perhaps the wettest summer in history. PDF here.

Photo by Bob Jagendorf
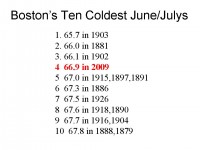
Also Boston is coming in with the fourth coldest June/July period since records began in 1872. It averaged 69.15 in June/July ranking it behind only 1903, 1881 and 1902. Notice all the other years in the top ten were in the 1800s and early 1900s.
Larger image here.
RECORD COLD JULYS
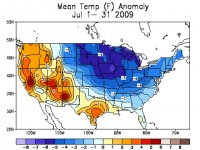
Also note the record cold July in Rockford, IL here. Also in other areas of northwest IL and northeast IA here. July 2009 will go down as the coldest in recorded history for Madison, Wisconsin (records go back to 1869). The previous record was July 1891. The highest temperature recorded in July 2009 was 82 degrees. This is also a record. The previous record was 84 in July 1869. It was also the coldest ever in Rhinelander, Appleton and Stevens Point, WI. It was the coldest ever July in International Falls.
It was the second coldest in Indianapolis, IN, and coldest in several other locations in northern Indiana including Fort Wayne. It was coldest ever in Peoria and Lincoln, IL. It was the coldest ever in Grand Rapids, MI. It was record cold also in Flint, Saginaw and Benton Harbor. It may be the coldest July ever statewide in Iowa. It was the third coldest summer in Kansas City. It was the coldest ever in Jackson, KY and Huntington, WV.
See larger image here.
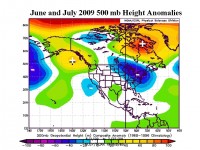
In the Pacific Northwest due to their version of the Santa Ana downslope winds and large northwestern ridge associated with the developing El Nino, Portland, Oregon came in with their second warmest July behind 1985. This same ridge has kept the north central and east cold. This west ridge and east trough pattern is also consistent with low solar, high latitude volcanic summers. The Arctic and North Atlantic Oscillations (AO and NAO) have been persistently negative (see the oranges and reds in the Arctic, Greenland representing anomalously high pressure) which helps anchor this pattern.
See how well the factors predicted this cool north central and eastern summer even back in May here.
By the way, the South Pole had an average temperature of minus 86.8 degrees F, breaking the July record set back in 1965.
See what poster Mark Vogan thinks of the extreme July, the quiet start to the tropical season and the sun’s odd behavior here.
Guest Post by David Archibald on Watts Up With That
NASA’s David Hathaway has adjusted his expectations of Solar Cycle 24 downwards. He is quoted in the New York Times here Specifically, he said:
“Still, something like the Dalton Minimum - two solar cycles in the early 1800s that peaked at about an average of 50 sunspots - lies in the realm of the possible.”
NASA has caught up with my prediction in early 2006 of a Dalton Minimum repeat, so for a brief, shining moment of three years, I have had a better track record in predicting solar activity than NASA.
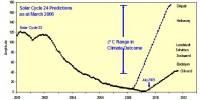
The graphic above is modified from a paper I published in March, 2006. Even based on our understanding of solar - climate relationship at the time, it was evident the range of Solar Cycle 24 amplitude predictions would result in a 2C range in temperature. The climate science community was oblivious to this, despite billions being spent. To borrow a term from the leftist lexicon, the predictions above Badalyan are now discredited elements.
Let’s now examine another successful prediction of mine. In March, 2008 at the first Heartland climate conference in New York, I predicted that Solar Cycle 24 would mean that it would not be a good time to be a Canadian wheat farmer. Lo and behold, the Canadian wheat crop is down 20% this year due to a cold spring and dry fields. Story here.
The oceans are losing heat, so the Canadian wheat belt will just get colder and drier as Solar Cycle 24 progresses. As Mark Steyn recently said, anyone under the age of 29 has not experienced global warming. A Dalton Minimum repeat will mean that they will have to wait to the age of 54 odd to experience a warming trend.
Where to now? The F 10.7 flux continues to flatline. All the volatility has gone out of it. In terms of picking the month of minimum for the Solar Cycle 23/24 transition, I think the solar community will put it in the middle of the F 10.7 quiet period due to the lack of sunspots. We won�t know how long that quiet period is until solar activity ramps up again. So picking the month of minimum at the moment may just be guessing.
Dr Hathaway says that we are not in for a Maunder Minimum, and I agree with him. I have been contacted by a gentleman from the lower 48 who has a very good solar activity model. It hindcasts the 20th century almost perfectly, so I have a lot of faith in what it is predicting for the 21st century, which is a couple of very weak cycles and then back to normal as we have known it. I consider his model to be a major advance in solar science.
What I am now examining is the possibility that there will not be a solar magnetic reversal at the Solar Cycle 24 maximum. Read more and comments here.
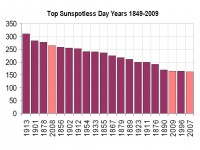
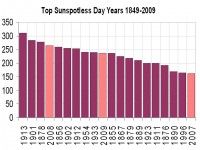
Icecap Note: The sun is quiet again for going on 3 weeks. A reader suggested a more accurate source of annual sunspotless days here. It had some additional years in the late 1800s with over 150 spotless days. The current string of spotless days since the flurry of activity early in July is 23. That brings the total for the year to 165. That is just ahead of the 163 in 2007 and in a tie with 1996. It puts us in 18th place now in the period since 1850. Last year in this data base we were still ranked 4th highest since 1849 but with 265 spotless days. If we continued to have spotless days on 77% of the days as has been the case the first 7 months of 2009, we would top last year. In any event we should reach the top 10 at least. Also the only other three successive years in the top 20 were 1911, 1912 and 1913.
This data base does not include the years before and during the Dalton Minimum. Larger image here.
By Marc Morano - Climate Depot
An outpouring of skeptical scientists who are members of the American Chemical Society (ACS) are revolting against the group’s editor-in-chief—with some demanding he be removed—after an editorial appeared claiming “the science of anthropogenic climate change is becoming increasingly well established.”
The editorial claimed the “consensus” view was growing “increasingly difficult to challenge, despite the efforts of diehard climate-change deniers.” The editor now admits he is “startled” by the negative reaction from the group’s scientific members. The June 22, 2009 editorial in Chemical and Engineering News by editor in chief Rudy Baum, is facing widespread blowback and condemnation from American Chemical Society member scientists. Baum concluded his editorial by stating that “deniers” are attempting to “derail meaningful efforts to respond to global climate change.”
Dozens of letters were published on July 27, 2009 castigating Baum, with some scientists calling for his replacement as editor-in-chief. The editorial was met with a swift, passionate and scientific rebuke from Baum’s colleagues. Virtually all of the letters published on July 27 in castigated Baum’s climate science views. Scientists rebuked Baum’s use of the word “deniers” because of the terms “association with Holocaust deniers.” In addition, the scientists called Baum’s editorial: “disgusting”; “a disgrace”; “filled with misinformation”; “unworthy of a scientific periodical” and “pap.”
One outraged ACS member wrote to Baum: “When all is said and done, and you and your kind are proven wrong (again), you will have moved on to be an unthinking urn for another rat pleading catastrophe. You will be removed. I promise.”
Baum ‘startled’ by scientists reaction
Baum wrote on July 27, that he was “startled” and “surprised” by the “contempt” and “vehemence” of the ACS scientists to his view of the global warming “consensus.” “Some of the letters I received are not fit to print. Many of the letters we have printed are, I think it is fair to say, outraged by my position on global warming,” Baum wrote.
Selected Excerpts of Skeptical Scientists:
“I think it’s time to find a new editor,” ACS member Thomas E. D’Ambra wrote.
Geochemist R. Everett Langford wrote: “I am appalled at the condescending attitude of Rudy Baum, Al Gore, President Barack Obama, et al., who essentially tell us that there is no need for further research - that the matter is solved.”
ACS scientist Dennis Malpass wrote: “Your editorial was a disgrace. It was filled with misinformation, half-truths, and ad hominem attacks on those who dare disagree with you. Shameful!”
ACS member scientist Dr. Howard Hayden, a Physics Professor Emeritus from the University of Connecticut: “Baum’s remarks are particularly disquieting because of his hostility toward skepticism, which is part of every scientist’s soul. Let’s cut to the chase with some questions for Baum: Which of the 20-odd major climate models has settled the science, such that all of the rest are now discarded? Do you refer to ‘climate change’ instead of ‘global warming’ because the claim of anthropogenic global warming has become increasingly contrary to fact?”
Edward H. Gleason wrote: “Baum’s attempt to close out debate goes against all my scientific training, and to hear this from my ACS is certainly alarming to me...his use of ‘climate-change deniers’ to pillory scientists who do not believe climate change is a crisis is disingenuous and unscientific.”
Atmospheric Chemist Roger L. Tanner: “I have very little in common with the philosophy of the Heartland Institute and other ‘free-market fanatics,’ and I consider myself a progressive Democrat. Nevertheless, we scientists should know better than to propound scientific truth by consensus and to excoriate skeptics with purple prose.”
William Tolley: “I take great offense that Baum would use Chemical and Engineering News, for which I pay dearly each year in membership dues, to purvey his personal views and so glibly ignore contrary information and scold those of us who honestly find these views to be a hoax.”
William E. Keller wrote: “However bitter you (Baum) personally may feel about CCDs (climate change deniers), it is not your place as editor to accuse them - falsely - of nonscientific behavior by using insultingly inappropriate language. [...] The growing body of scientists, whom you abuse as sowing doubt, making up statistics, and claiming to be ignored by the media, are, in the main, highly competent professionals, experts in their fields, completely honorable, and highly versed in the scientific method - characteristics that apparently do not apply to you.”
ACS member Wallace Embry: “I would like to see the American Chemical Society Board ‘cap’ Baum’s political pen and ‘trade’ him to either the New York Times or Washington Post.” [To read the more reactions from scientists to Baum’s editorial go here.]
Physicists Dr. Lubos Motl, who publishes the Reference Frame website, weighed in on the controversy as well, calling Baum’s editorial an “alarmist screed.”
“Now, the chemists are thinking about replacing this editor who has hijacked the ACS bulletin to promote his idiosyncratic political views,” Motl wrote on July 27, 2009. Baum cites discredited Obama Administration Climate Report to “prove’ his assertion that the science was “becoming increasingly well established,” Baum cited the Obama Administration’s U.S. Global Change Research Program (USGCRP) study as evidence that the science was settled. [Climate Depot Editor’s Note: Baum’s grasp of the latest “science” is embarrassing. For Baum to cite the June 2009 Obama Administration report as “evidence” that science is growing stronger exposes him as having very poor research skills. See this comprehensive report on scientists rebuking that report.
Baum also touted the Congressional climate bill as “legislation with real teeth to control the emission of greenhouse gases.” [Climate Depot Editor’s Note: This is truly laughable that an editor-in-chief at the American Chemical Society could say the climate bill has “real teeth.” This statement should be retracted in full for lack of evidence. The Congressional climate bill has outraged environmental groups for failing to impact global temperatures and failing to even reduce emissions! See: Climate Depot Editorial: Climate bill offers (costly) non-solutions to problems that don’t even exist - No detectable climate impact: ‘If we actually faced a man-made ‘climate crisis’, we would all be doomed’ June 20, 2009 ]
The American Chemical Society’s scientific revolt is the latest in a series of recent eruptions against the so-called “consensus” on man-made global warming. See more here. Read this Planet Gore post by Edward John Craig on the Chemists revolt “When real scientists finally get a chance to vent their opposition to global warming mythology, and more importantly, to have it published in a widely read publication, it’s the beginning of the end of the alarmists’ stranglehold” here.
See also the letter to the American Physical Society requesting a more accurate statement on the current status of climate change science here and the posting in Nature on this letter here.
“Today’s debate about global warming is essentially a debate about freedom. The environmentalists would like to mastermind each and every possible (and impossible) aspect of our lives.”
Vaclav Klaus, Blue Planet in Green Shackles
Resisting climate hysteria
By Richard S. Lindzen, Quadrant Magazine, July 26, 2009
A Case Against Precipitous Climate Action
The notion of a static, unchanging climate is foreign to the history of the earth or any other planet with a fluid envelope. The fact that the developed world went into hysterics over changes in global mean temperature anomaly of a few tenths of a degree will astound future generations. Such hysteria simply represents the scientific illiteracy of much of the public, the susceptibility of the public to the substitution of repetition for truth, and the exploitation of these weaknesses by politicians, environmental promoters, and, after 20 years of media drum beating, many others as well.
Climate is always changing. We have had ice ages and warmer periods when alligators were found in Spitzbergen. Ice ages have occurred in a hundred thousand year cycle for the last 700 thousand years, and there have been previous periods that appear to have been warmer than the present despite CO2 levels being lower than they are now. More recently, we have had the medieval warm period and the little ice age. During the latter, alpine glaciers advanced to the chagrin of overrun villages. Since the beginning of the 19th Century these glaciers have been retreating. Frankly, we don’t fully understand either the advance or the retreat.
For small changes in climate associated with tenths of a degree, there is no need for any external cause. The earth is never exactly in equilibrium. The motions of the massive oceans where heat is moved between deep layers and the surface provides variability on time scales from years to centuries. Recent work (Tsonis et al, 2007), suggests that this variability is enough to account for all climate change since the 19th Century. Supporting the notion that man has not been the cause of this unexceptional change in temperature is the fact that there is a distinct signature to greenhouse warming: surface warming should be accompanied by warming in the tropics around an altitude of about 9km that is about 2.5 times greater than at the surface. Measurements show that warming at these levels is only about 3/4 of what is seen at the surface, implying that only about a third of the surface warming is associated with the greenhouse effect, and, quite possibly, not all of even this really small warming is due to man (Lindzen, 2007, Douglass et al, 2007). This further implies that all models predicting significant warming are greatly overestimating warming.
This contradiction is rendered more acute by the fact that there has been no statistically significant net global warming for the last fourteen years. Modelers defend this situation by arguing that aerosols have cancelled much of the warming, and that models adequately account for natural unforced internal variability. However, a recent paper (Ramanathan, 2007) points out that aerosols can warm as well as cool, while scientists at the UK’s Hadley Centre for Climate Research recently noted that their model did not appropriately deal with natural internal variability thus demolishing the basis for the IPCC’s iconic attribution (Smith et al, 2007). Interestingly (though not unexpectedly), the British paper did not stress this. Rather, they speculated that natural internal variability might step aside in 2009, allowing warming to resume. Resume? Thus, the fact that warming has ceased for the past fourteen years is acknowledged. It should be noted that, more recently, German modelers have moved the date for ‘resumption’ up to 2015 (Keenlyside et al, 2008).
This should not be surprising (though inevitably in climate science, when data conflicts with models, a small coterie of scientists can be counted upon to modify the data. Thus, Santer, et al (2008), argue that stretching uncertainties in observations and models might marginally eliminate the inconsistency. That the data should always need correcting to agree with models is totally implausible and indicative of a certain corruption within the climate science community).
With all this at stake, one can readily suspect that there might be a sense of urgency provoked by the possibility that warming may have ceased and that the case for such warming as was seen being due in significant measure to man disintegrating. For those committed to the more venal agendas, the need to act soon, before the public appreciates the situation, is real indeed. However, for more serious leaders, the need to courageously resist hysteria is clear. Wasting resources on symbolically fighting ever present climate change is no substitute for prudence. Nor is the assumption that the earth’s climate reached a point of perfection in the middle of the twentieth century a sign of intelligence. Read full essay here.
By George Taylor
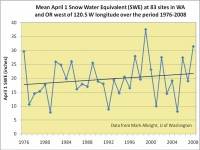
Washington Governor Gregoire recently sent a letter to the Washington House delegation in which she stated that the snow pack has declined 20% over the past 30 years: “Last month, a study released by the University of Washington shows we’ve already lost 20% of our snow pack over the last 30 years.”
Actual snow pack numbers show a 22% INCREASE in snow pack over the past 33 years across the Washington and Oregon Cascade Mountains:
Larger image here. See post here.
ICECAP NOTE: In this story on Sustainable Oregon, George shows how choosing start and end dates makes all the difference in trend analysis. This is true because precipitation trends in the northwest are linked to the PDO cycle of 60 or so years. In the cold phase, La Ninas and heavy snowpacks are common (like the last two years) and in the warm phase, El Ninos and drier winters (as was the case from the 1970s to late 1990s). By cherry picking his start data as 1950 at the very snowy start of the cold PDO phase from 1947 to 1977 and ending in 1997 at the end of the drier warm PDO phase from 1979 to 1998, Mote was able to extract a false signal which he attributed to man made global warming.
Arguing this point made George Taylor, state climatologist for decades in Oregon a target (he took early retirement) and cost the assistant state climatologist in Washington, Mark Albright, his job. Phil Mote, the alarmist professor and author of a discredited work on the western snowpack for the Bulletin of the American Meteorological Society doesn’t accept criticism lightly. He ironically was appointed to the state climatologist position George Taylor held in Oregion. It was Phil who fired Mark for challenging his findings. That is the way it is in the university climate world today, real data doesn’t matter so don’t bother to look and if you need to work with data, pick and choose carefully. Anyone who disagrees publically and risks funding need look elsewhere for employment.
George shows the 1950 to 1997 trend and the longer term trend analysis for several stations with good records showing no discernible long term trends. Mote, whose Ph.D. is from the University of Washington, surmises that Taylor is guilty of looking only at data that support his views, while discarding the rest. “You can only come to that conclusion if you handpick the climate records,” Mote says. Willamette Week, August 24th, 2005
The story doesn’t end there as this post by Jeff ID called SNOWMEN tells, another climate schiester, Eric Steig who made the headline last year when he worked with Michael Mann, the king of data manipulation and cherrry-picking to eliminate the antarctic cooling of the last several decades. Eric chimed in against Taylor and Albright defending Mote and making false or at least uninformed claims about trends. It is clear from Steig’s Real Climate post never even looked at the whole data trends. Jeff correctly notes “These plots are of specific stations, however they demonstrate that at least for the above locations the 1950-1997 trend is a cherry pick, nothing more.”
Unfortunately thess bad analysis has gotten people promoted and been used by state governments to make unwise decisions like supporting the flawed and costly and totally unnecessary WCI (Western Climate Initiative), which Paul Chesser writes about in this American Spectator story here. Climate alarmists like Mann, Mote and Steig and agenda driven politicians like Gregoire have a lot to answer for, if the governments measures inflict major pain on the citizens and the globe continues to cool in its natural rythym.
See Paul Chesser’s follow-up story on the Governor’s use/misuse of this faulty information to move forward her agenda despite the legislature’s opposition here.
By Joseph D’Aleo, CCM, AMS Fellow
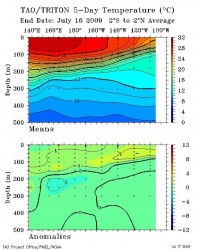
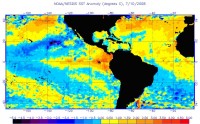
The official El Nino criteria has been met. Now the meteorological world looks to see how strong and how long this lasts. Count on CPC and other forecast centers to go for a warm winter as a result of El Nino but as we have shown, there are differences in El Ninos depending on the overall mode in the Pacific Basin (the PDO). The tropical Pacific sea surface temperatures this week are shown here.
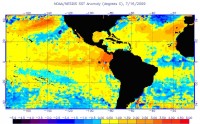
You can see the warm plume along the tropical easterly belt along the equator. The depth cross section shows the pool of warm water that has suppressed the thermocline in the eastern Pacific enlarged here.
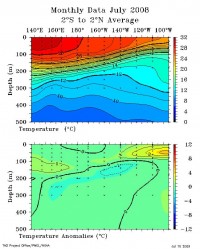
The oceans tried this last year in the early summer, but the warmth stayed in the eastern Pacific (enlarged here).
The cross section looked similar last July to the one this last week although it was a little colder in the central Pacific near the surface and beneath the thermocline. See larger here.
See an animation of the ocean temperatures over the last years as the feeble El Nino attempt failed, La Nina returned and then El Nino developed here.
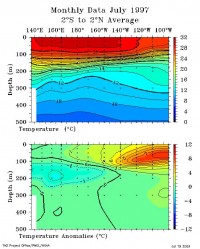
The El Nino of 2002/03 was another similar year. 1997/98 was dramatically stronger at this point of the preceding summer. Compare with the super 1997/98 event in July 1997 (enlarged here).
What’s Different
The CDC’s Multivariate ENSO Index shows this year’s warming is stronger than last year but tracking along a similar path. (larger image here)
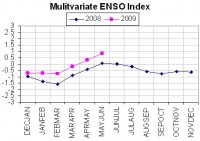
The ocean heat content east of the dateline in the tropical Pacific is also greater this year. However sub surface anomalies have diminished the last few weeks and the heat content here shown may soon peak. The Southern Oscillation Index has been positive (La Nina territory) much of the last month. Is it possible like last year, the warming fails to persist? I suspect it will continue to come on become a weak to moderate El Nino that peaks perhaps before winter.
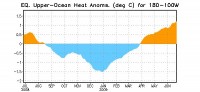
Enlarged here.
El Ninos in negative PDO eras tend to be shorter, weaker and colder (USHCN GISS version -0.12F) compared to El Ninos in a positive PDO era (+1.08F). Some of that is the data contamination (siting) issue which is greater in the recent +PDO era 1979-1998 than in the prior cold PDO 1950-1978. The ENSO models see this as a stronger event but with some hints it may peak before winter. See those forecasts and also related changes to the PDO, AMO and the possible implications here.
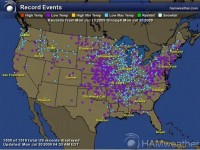
Also see more evidence of the cold summer typical of onset El Ninos in this map plot of the stations with 651 record low and 868 record low maxima temperatures for the US the last week courtesy of Global Freeze.
**********************
The Morality of Climate Change: (Uploaded 18 July 2009)
One has to know all the facts to determine the morality of an issue. John Christy on CO2Science.org, below and enlarged here.
See this town hall attack on Mike Castle, one of the Republicans who voted FOR Cap-and-Trade below.
Historic winter storm in South America
By Alexandre Aguiar / MetSul Weather Center
A major and historic winter storm is underway at this Wednesday morning in Argentina. Snow is falling in many parts of the country and in many areas not used to winter precipitation. Local news reports indicate snow already have been observed in the provinces of Mendoza, San Luis, San Juan, Cordoba, La Pampa and Buenos Aires.
In Bahia Blanca, a coastal city in the Southern part of the Buenos Aires, the snow storm is heavy and local authorities describe it as the worst snow event in 50 years. Roads are already blocked by snow and ice in the regional. TN news channel reports some areas of the Sierra de La Ventana could pick up even 3 feet of snow, unimaginable to the region.
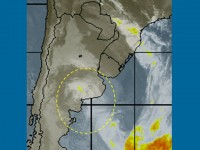
Satellite image enlarged here.
Early this Wednesday afternoon, satellite pictures were showing a band of clouds advancing to the North and snow precipitation could no be ruled out in the capital Buenos Aires. In July 9th and 10th 2007 it snowed in the city of Buenos Aires for the first time in 89 years and it could snow again just two years later. Icecap note: snow mixed with the rain at Ezeiza a suburb of Buenos Aires at 5, 6 and 7 pm local time.
Snow was also reported in the capital of Chile, Santiago.
Intense cold winter storm off Buenos Aires- enlarged here.
MetSul Weather Center is not ruling out snow also in Uruguay. Our WRF model forecast scattered snow to neighboring Uruguay in the next 48 hours. The vast part of Uruguay is at sea level and snow is quite unusual in the region. MetSul is also advising the public and its clientele in Brazil about a severe cold outbreak in Southern Brazil in the next few days with lows only seen this decade in the historic events of July 2000 and July 2007.

Snow picture enlarged here.
See PDF here.
----------------------------
SUNSPOTLESS DAY UPDATE
After the early month active sunspot region rotated off the visible disk, we have had 16 more days without a sunspot.
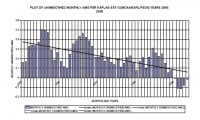
The total number of sunspotless days this protracted solar minimum now stands at 158 days this year and 669 total. With one more day, 2009 enters the list of the top dozen most spotless years, and one more week, the top ten. See plot below as of July 26, 2009.
Larger image here.
By Joseph D’Aleo CCM, AMS Fellow
NOAA has as expected announced that June 2009 for the globe was the second warmest June in 130 years, falling just short of 2005. NASA GISS which starts with NCDC GHCN and then adds their own special touches had this June the second warmest on record just behind 1998.
In SHARP contrast, NASA UAH MSU satellite assessment had June virtually normal (+0.001C or 15th coldest in 31 years) and RSS (+0.075C or 14th coldest in 31 years). This is becoming a habit.
NOAA proclaimed May 2009 to be the 4th warmest for the globe in 130 years of record keeping. Meanwhile NASA UAH MSU satellite assessment showed it was the 15th coldest May in the 31 years of its record. This divergence is not new and has been growing. Just a year ago, NOAA proclaimed June 2008 to be the 8th warmest for the globe in 129 years of record keeping. Meanwhile NASA satellites showed it was the 9th coldest June in the 30 years of its record.
We have noted in the last year that NOAA has often become the warmest of the 5 major data sets in their monthly global anomalies. They were second place until they removed the USHCN UHI adjustment in 2007 and introduced a new ocean data set recently.
NOAA and the other ground based data centers would have more credibility if one of the changes resulting in a reduction of the warming trend and not an exaggeration which has been the case each and every time.
THE MANY ISSUES WITH THE STATION BASED DATA CENTERS
NOAA and the other station base data centers suffer from major station dropout (nearly 3/4ths of the stations) many of them rural, there has been a tenfold increase in missing months in remaining stations, no adjustment for urbanization even as the population grew from 1.5 billion to 6.7 billion since 1900 and documented bad station siting for 90% of the observing sites in the United States and almost certainly elsewhere.
You can see the coverage difference between the stations on this GISS analysis of the NOAA gathered stations from 1978 versus that in 2008.
You can see the stations grow then suddenly disappear in this animation from John W. Goetz on WUWT here. See in today’s John Goetz post 1079 stations worldwide contributed to the GISS analysis, 134 of them being located in the 50 US states. Many, many hundreds of stations that have historically been included in the record and still collect data today continue to be ignored by NOAA and GISS in global temperature calculations (in 1970s the number of stations totaled well over 6000). Data is available in the large holes in places like Canada and Brazil and Africa, but NOAA appears not interested in accessing it. The last year has been very cold in Canada.
Also they in the last year made changes to the ocean temperature data base removing the satellite data that they claimed was giving a cold bias to the data. The oceans now are shown to be warm just about everywhere and was the warmest of the record. See NOAA’s map below and larger here. Note most of the world’s ocean were warmer than normal (for the oceans it was the warmest year). The paper used to justify this ‘improvement’ was co-authored by NOAA chief alarmist (tied maybe with Susan Solomon) Tom Peterson. Peterson’s prior peer review but later debunked work was responsible for the removal of the urban heat island adjustment in 2007 from USHCN.
Compare that with UNISYS’s recent anomaly chart - notice how much of the ocean is cold.
SATELLITE A BETTER WAY
Satellite are widely believed to be the most reliable source of reliable trend information after you calibrate the differences as one bird gets phased out and a new one goes online. UAH and RSS have gotten very good at this in a very cooperative way in recent years. Satellites provide full coverage of the globe including the oceans which cover 70% of the earth’s surface.
When you do a difference in the satellite trends of both UAH and RSS with NOAA NCDC land stations, you see an increasing warm bias in the NOAA data which explains why months with major cold in the news get ranked so high by NOAA and not by the satellite sources. The difference started small in 1979 but is now approaching 0.5C (almost 1F)!.
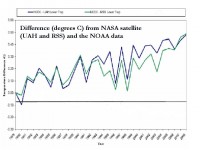
Graph of the difference between NOAA and NASA UAH and RSS (Klotzbach et al 2009). See larger image here.
The satellite data is regarded even by NOAA administration to be the most reliable but they don’t use it in releases as it is only available for 30 years. It has shown a cooling since 2002.
See larger image here.
NCDC’S TOM KARL DISPUTES SATELLITE DATA IN TREND ANALYSIS
This post from Watts Up With That on June RSS data, Anthony mentions how in testimony in March 2009 before congress, NCDC’s director Tom Karl opined about satellite data and the “adjustments” required:
�It is important to note raw satellite data and rapidly produced weather products derived from satellite sensors are rarely useful for climate change studies. Rather, an ordered series of sophisticated technical processes, developed through decades of scientific achievement, are required to convert raw satellite sensor data into Climate Data Records (CDRs).”
Anthony quips “You mean ”sophisticated technical processes” like these performed on raw surface temperature data at NCDC?”
Source here enlarged.
Given NOAA’s efforts to penalize false reporting as this release on the NOAA home page: NOAA Imposes Fine and Penalty for False Reporting in Alaska Fishery July 1, 2009
“A hired master, vessel owners and permit holders of the Alaskan fishing vessel Trident have agreed to pay more than $18,000 in penalties and $241,000 worth of sanctions for falsely reporting areas fished by the vessel on five trips during 2006 and 2007. The violations were detected and investigated by the Alaska division of NOAA’s Fisheries Service Office of Law Enforcement, and the charges were brought by NOAA’s Office of General Counsel.”
NOAA’s OGC should be looking at their own data centers and the architects, Tom Peterson and Tom Karl. See PDF here.
By Roger Pielke Sr., Climate Science Blog
We have a new paper accepted. It is
Fall, S., D. Niyogi, A. Gluhovsky, R. A. Pielke Sr., E. Kalnay, and G. Rochon, 2009: Impacts of land us land cover on temperature trends over the continental United States: Assessment using the North American Regional Reanalysis. Int. J. Climatol., accepted.
This paper (and other such publications) avoids systematic biases in using reanalyses with respect to the the 2m temperatures that were identified by the Pitman and Perkins (2009) paper (see). As explained by Eugenia Kalnay in an e-mail to me last week, working with anomalies eliminates those types of bias in the 2m temperatures.
The abstract of the new Fall et al paper is
“We investigate the sensitivity of surface temperature trends to land use land cover change (LULC) over the conterminous United States (CONUS) using the observation minus reanalysis (OMR) approach. We estimated the OMR trends for the 1979-2003 period from the US Historical Climate Network (USHCN), and the NCEP-NCAR North American Regional Reanalysis (NARR). We used a new mean square differences (MSDs) based assessment for the comparisons between temperature anomalies from observations and interpolated reanalysis data. Trends of monthly mean temperature anomalies show a strong agreement, especially between adjusted USHCN and NARR (r = 0.9 on average) and demonstrate that NARR captures the climate variability at different time scales. OMR trend results suggest that unlike findings from studies based on the global reanalysis (NCEP/NCAR reanalysis), NARR often has a larger warming trend than adjusted observations (on average, 0.28 and 0.27C/decade respectively). OMR trends were found to be sensitive to land cover types. We analyzed decadal OMR trends as a function of land types using the Advanced Very High Resolution Radiometer (AVHRR) and new National Land Cover Database (NLCD) 1992-2001 Retrofit Land Cover Change.
Results indicate that when the dynamic nature of LULC is taken into account, the magnitude of OMR trends is larger than the ones derived from a “static” LULC dataset and land use conversion often results in more warming than cooling. Overall, our results confirm the robustness of the OMR method for detecting nonclimatic changes at the station level, evaluating the impacts of adjustments performed on raw observations, and demonstrating sensitivity to LULC changes at local and regional scales. Since the majority of warming trends that we identify can be explained on the basis of LULC changes, we suggest that in addition to considering the greenhouse gases driven radiative forcings, multi-decadal and longer climate models simulations must further include LULC changes.”
Text in the conclusion includes
“The need to separate the local from the regional land use change effect on the temperature record does merit further study, as the later is a regional climate forcing effect, while the local microclimate and non-climatic station effects are a contamination of the temperature data in terms of constructing regional scale temperature trends.
Since the majority of warming trends that we identify can be explained on the basis of land use/land cover changes, we suggest that in addition to considering the well-mixed greenhouse gases and aerosol driven radiative forcings, multi-decadal and longer climate models simulations must further include land cover/land use changes. In terms of using long term surface temperature records as a metric to monitor climate change, there also needs to be further work to separate the local microclimate and non-climate station effects from the regional land use/land cover change effects on surface temperatures.” See post here.
By Marty Toohey
For the past decade, Austin’s ambition to become the world’s clean-energy capital has been best exemplified by one effort: GreenChoice, a program that sells electricity generated entirely from renewable sources such as wind. Now the nationally renowned program is struggling to find buyers - the latest allotment is 99 percent unsold after seven months on the market - and Austin Energy is looking for ways to bring down the rising costs.
But those are short-term talks. Austin Energy officials say that times have changed and that the nation’s most successful (by volume of sales) green-energy program, which offers the renewable energy only to those who select it, might no longer be the best way to carry out the city’s goals. It now costs almost three times more than the standard electricity rate. “I think it’s time to sit back and look at the philosophy behind GreenChoice,” said Roger Duncan, the head of Austin Energy and the chief architect of GreenChoice.
It was established in 2000, when Austin Energy decided to buy power coming from a wind farm in West Texas. Customers could choose to get their electricity entirely from the plant. About 3,500 homes and businesses signed up. As Austin Energy bought wind from additional plants, it began offering successive GreenChoice “batches.” Some customers may have signed up out of a personal or corporate commitment to environmental responsibility.
But, Austin Energy spokesman Ed Clark said, many were attracted to the certainty that GreenChoice provided. Although it generally cost a little more than standard electricity, a GreenChoice contract guaranteed a price would not change for a decade. Because of that promise, there were times when coal, oil and natural gas prices spiked and made them more expensive than GreenChoice. “Customers got a 10-year fixed cost - that’s why it sold out,” Clark said. “It was designed to be a value proposition to customers, instead of just asking them to pay more to be environmentally friendly.”
But lately, customers haven’t been sold on that proposition. While previous offerings took about half a year to sell out, the current one has attracted only 104 homes and five businesses - leaving about 99 percent of its power unpurchased, according to Austin Energy. The reason is that GreenChoice prices have risen more than fivefold since the program started. GreenChoice now would add about $58 a month to the electricity bill of an average home.
Businesses, which currently buy 83 percent of GreenChoice power and which tend to have much larger monthly bills, face bigger hits to their bottom line. Austin Energy officials say GreenChoice prices have risen mainly for reasons beyond their control. Steel, concrete, copper and labor have all gotten more expensive, in turn making wind-farm construction more costly.
But there is another problem that could soon be resolved, he said. Texas doesn’t have enough transmission lines to carry all the electricity generated in West Texas to the state’s big cities. This in turn means Austin has to pay more to get its wind energy here. But, Sweeney said, the state is in the process of approving a plan for utilities to build $6 billion in new transmission lines. This change could allow Austin Energy to lower its GreenChoice price. But, Sweeney cautioned, any lowering of costs “won’t be dramatic.” Others say the city could cut the cost more than it’s letting on.
City officials say that despite the price spike, they will not abandon wind energy. Partly, this is because they expect wind prices to stabilize while fossil-fuel prices rise dramatically. Partly, it’s because the City Council has mandated that Austin Energy generate 30 percent of its electricity from renewable sources by 2020. But even if Austin Energy manages to bring down the price of wind power, GreenChoice will face other challenges.
For instance, the city has to sell the power from the solar array near Webberville. Some businesses have objected to paying for the relatively expensive power. The City Council’s solution was to tell Austin Energy to explore offering the solar power under GreenChoice. But, as Duncan noted to the City Council, the current batch of GreenChoice is already struggling because of its price. And power from the solar array will cost about twice as much. Read more.
AMO, The Key Global Climate IndicatorBy Matt Vooro
The AMO is an ongoing series of long-duration changes in the sea surface temperature of the North Atlantic Ocean, with cool and warm phases that may last for 20-40 years at a time and a difference of about 1F between extremes. These changes are natural and have been occurring for at least the last 1,000 years. [per NOAA].
The AMO index is calculated at NOAAPSD by using the Kaplan SST data set [5x5], determining the area weighted average over the North Atlantic over 0-70N and then detrending this data. The average AMO index or the Atlantic Multidecadal Oscillation index went negative or cool in January 2009 The average for the first 5 months this year is about [-0.06] . It has been cooling since 2003. In the past, the very cold seasons of North America and especially the East coast happened when the annual average AMO went cool [ as low as -0.405] in the 1970’s.
It seems that this level of cool AMO may be several years off as the AMO cooling rate appears to be still slow. Back in 1964 it took about 8 years before the AMO went to [-0.3] by 1971. Review of other periods for similar rates of decline of the AMO show a spread of about 2-8 years. However the solar activity was much higher during 1964-1972 and things may cool down faster currently with extended solar minimum and anticipated low future solar cycles. If AMO does drop faster, then the cold weather like 1964-1979 may be the norm here much sooner and the East Coast will cool down as well as will the globe. The most sustained number of low AMO levels was during the cold spell of 1902 -1925 and again the 1970’s.
The graph below shows how closely Annual Global Air Temperature Anomalies [Crutem3] follow the Atlantic Multidecadal Oscillation Index [AMO] below and enlarged here.
The last interval change was 1994 or about 15 years ago and according to Enfeld et.al (2005), the probability that AMO will switch to cool in 15 years is about 80%. Based on this analysis , there is a high probability that the current cooling phase of AMO which started in 2009 is real and likely sustainable for the next 20 years at least.
The graph below shows the decline of the AMO index from warm to cool between 2005 and 2009 below and enlarged here.
EL NINO 2009-2010
There has been an El Nino within about 12 months after each of the last four solar minimums. The same pattern seems to be developing again now. The El Nino may be a moderate or weak and short lived [about a year]. It may have a minor effect on global temperatures, like in the period 1965-1966 when US temperatures continued to drop despite the El Nino.
AMO appears to be like a thermostat or predictor of global temperatures. ENSO events if moderate or strong seem to modify, amplify or over-ride the AMO effects. This pattern will continue to bring cool yearly temperatures and colder and snowy winters like 2008 and 2009. My best guess is that the climate of the 1960’and 1970’s will be our climate for the next several decades [2-3] at least, and inter-dispersed with periodic warm years. PDO and AMO readings are of limited value for short term use but quite useful and accurate for decadal forecasts. Currently 2009 looks something like 1971 [cool PDO, low cool/ near neutral AMO] and the rest of this decade looks like the 1970’s if you had pick one decade from the past. The 1960’s and the 1950 are also close behind.
This latest period of cooler weather is not the start of some modern ice age or new grand cold minimum but just another cool cycle of the planet that happens about after every 20-30 years more recently when AMO and PDO are both in the cool mode simultaneously. The coldest last such cycle 1902-1925 when AMO hit a single month low of -0.563 and PDO went down to -1.72 and global air temperature anomalies plummeted to -0.581C [crutem3] in 1911. Other such cool periods occurred 1964-1976 and also much earlier during the Dalton and Maunder Minimums. Read more here.
Icecap notes: See Matt’s earlier post here. See a 2008 post by Dr. Don Easterbrook on the PDO and NAO influences on a cooling climate here.
See also my recent Intellicast post “ El Ninos in a Cold PDO - Are they Different?”. See another older post “Taking a Time Machine Ride Back to the 1960s or 1800s?”. See also a story on the AMO here and PDO here. Another upcoming story will support Matt’s view on this upcoming El Nino. See an older Icecap post on the role of the oceans in climate here.
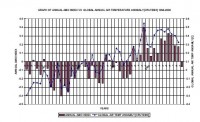
See how well the annual US temperatures (USHCNv2) correlates with both the oceans (PDO + AMO) and sun (Hoyt Schatten Willson Total Solar Irradiance or TSI calibrated to ACRIM). Enlarged here.

See larger version here of a simple multiple regression model using smoothed (11 point) PDO and AMO and USHCN v2 temperatures (r-squared 0.85).
Senator James Inhofe in the Politico
Listen carefully in Washington, and almost everyone agrees that nuclear energy must be a part of our future domestic energy mix, and for good reason: Nuclear energy is the world’s largest source of carbon-free energy, generating over 70 percent of our emission-free electricity here in the U.S. Nuclear energy is a clean, safe, reliable and domestic source of affordable energy that has created 15,000 new jobs in the last year.
The need to grow our domestic energy supply is clear. The Energy Information Administration projects that our demand for electricity will increase by 26 percent by the year 2030, requiring nearly 260 gigawatts of new electricity generation. Every source will need to grow and produce more energy to meet that demand. Curtis Frasier, executive vice president of Americas Shell Gas & Power, recently warned that the recession could be masking a global energy shortage: “When the economy returns, we’re going to be back to the energy crisis,” he said. “Nothing has been done to solve that crisis. We’ve got a huge mountain to climb.”
Frasier voices a very real concern. Electricity and total energy use are closely tied to economic growth. When our economy grows, so does the demand for energy. One way our energy policy can provide a solid foundation for economic growth is by supporting increased development of nuclear energy.
Not only will nuclear energy give a boost to our economy, it will also produce new jobs. Mark Ayers, president of the AFL-CIO Building and Construction Trades Department, has stated: “We will work closely with the nuclear energy industry to help pursue the adoption of a diverse American energy portfolio that places a high priority on the re-emergence of nuclear power.” Why is Ayers so supportive of nuclear energy? He knows the number of high-quality jobs that just one new nuclear plant would provide, including 1,400 to 1,800 jobs during construction; 400 to 700 permanent jobs when the plant begins operating, with salaries percent higher than the local average; and 400 to 700 additional jobs providing goods and services.
Ensuring nuclear energy continues to play an increasing role in our nation’s energy mix requires a commitment from Capitol Hill. My commitment is rooted in oversight, which I initiated over 12 years ago through my leadership position on the Senate Environment and Public Works Committee. The Nuclear Regulatory Commission has since been transformed into a more safety-focused, objective and efficient regulator capable of executing its responsibilities in a timely fashion. As such, I expect the NRC to maintain the high level of safety of the existing fleet while managing the additional challenge of new plant licensing.
So far, the NRC has done a good job coping with the onslaught of licensing activity. Reviews are proceeding simultaneously on four designs, one site permit and 18 license applications representing 28 new reactors. But, despite significant efforts on the part of NRC staff, this process hasn�t unfolded as smoothly as it could. In fact, there appear to be no actual dates when any of the new plant licenses will be issued. The commission must take responsibility for managing the licensing process and set detailed schedules, which are critical to ensuring that the process is safety-focused and efficient.
Companies will make decisions on whether to start construction based on future economics and perceived political risk. If the NRC becomes an unpredictable regulator, financial risk will escalate. How can a utility prepare for construction without a firm date on which they can expect to receive their license? How can an investor judge the risk of a project without being able to evaluate progress in the regulatory process?
My hope is to see the NRC issue the first new license for a reactor before the end of 2011, and eight more before 2013. Given construction estimates of four to five years, the first two reactors could be operational in 2016, with 14 more potentially operational by 2018. Sixteen new reactors will be a good start toward rejuvenating an industry that has been stagnant for over 30 years. These efforts to develop new plants are critical to meeting our energy needs, and I�m committed to doing what I can to help build these new plants.
Finally, if President Barack Obama is serious about creating jobs, cutting carbon emissions and producing more clean, domestic energy, it’s time for him to unambiguously support nuclear energy. There is one action more important than any other that he alone can take: nominating qualified, safety-focused and fair people to serve on the NRC. Our nation is best served by commissioners who are focused on protecting public health and safety and the environment. However, if Obama’s nominations reflect the desires of anti-nuclear ideologues, one thing will become clear: He’s willing to strangle the nuclear renaissance along with energy security and job creation. If that�s the case, then all his talk about the need to cut carbon emissions is just blowing smoke. See the op ed here.
Sen. James Inhofe (R-Okla.) is the ranking member of the Senate Environment and Public Works Committee.
By Marc Morano. Climate Depot
Below is an excerpt of NASA scientist James Hansen’s critique of the President Obama supported Waxman-Markey global warming cap-and-trade bill that passed the House and is now under consideration in the U.S. Senate. Hansen’s full critique appeared on July 9, 2009 in The Huffington Post. Hansen is director of the NASA Goddard Institute for Space Studies, but he writes on this policy-related topic as a private citizen.

Jim Hansen Excerpt:
“It didn’t take long for the counterfeit climate bill known as Waxman-Markey to push back against President Obama’s agenda. As the president was arriving in Italy for his first Group of Eight summit, the New York Times was reporting that efforts to close ranks on global warming between the G-8 and the emerging economies had already tanked.
This requires nothing less than an energy revolution based on efficiency and carbon-free energy sources. Alas, we won’t get there with the Waxman-Markey bill, a monstrous absurdity hatched in Washington after energetic insemination by special interests.
For all its “green” aura, Waxman-Markey locks in fossil fuel business-as-usual and garlands it with a Ponzi-like “cap-and-trade” scheme.
The fact is that the climate course set by Waxman-Markey is a disaster course. Their bill is an astoundingly inefficient way to get a tiny reduction of emissions. It’s less than worthless, because it will delay by at least a decade starting on a path that is fundamentally sound from the standpoints of both economics and climate preservation.
Here are a few of the bill’s egregious flaws:
* It guts the Clean Air Act, removing EPA’s ability to regulate CO2 emissions from power plants.
* It sets meager targets—2020 emissions are to be a paltry 13% less than this year’s level—and sabotages even these by permitting fictitious “offsets,” by which other nations are paid to preserve forests - while logging and food production will simply move elsewhere to meet market demand.
* Its cap-and-trade system, reports former U.S. Undersecretary of Commerce for Economic Affairs Robert Shapiro, “has no provisions to prevent insider trading by utilities and energy companies or a financial meltdown from speculators trading frantically in the permits and their derivatives.”
* It fails to set predictable prices for carbon, without which, Shapiro notes, “businesses and households won’t be able to calculate whether developing and using less carbon-intensive energy and technologies makes economic sense,” thus ensuring that millions of carbon-critical decisions fall short.” End Hansen Excerpt.
Climate Depot Editorial Note:
Even the strongest proponents of man-made global warming fears - NASA’s James Hansen and UK’s James Lovelock—are now ridiculing the Congressional cap-and-trade approach as “ineffectual” and “verging on a gigantic scam.” Adding to that, Green Party presidential nominee Ralph Nader has also voiced opposition to this bill, saying, “I’m really astonished… I mean, it’s not going to work. It’s too complex. It’s too easily manipulated politically.” Read more here.
CHICAGO (AFP) - Greenpeace activists were arrested Wednesday for scaling Mount Rushmore and hanging a banner next to the carved face of Abraham Lincoln urging President Barack Obama to get tough on climate change.
A video posted on the environmental group’s website showed the massive banner hanging on the South Dakota mountain face.
Its message -- “America honors leaders not politicians: Stop Global Warming” and an unfinished portrait of Obama -- was barely visible as it was whipped by wind.
“Doing what it takes to solve global warming demands real political courage,” Greenpeace USA deputy campaigns director Carroll Muffett said in a statement.
“If President Obama intends to earn a place among this country’s true leaders, he needs to show that courage, and base his actions on the scientific reality rather than political convenience.”
The protest comes as Obama meets with other G8 leaders in Italy. G8 leaders agreed to bear the brunt of steep global cuts in greenhouse gas emissions, saying developed countries should reduce their pollution by 80 percent by 2050, a summit declaration said.
Greenpeace said the 11 climbers “took special care not to damage the monument, using existing anchors placed by the National Park Service for periodic cleaning.” Park officials said they were still investigating whether the iconic monument—a restricted area which is closely monitored—suffered damage.
“Early this morning visitors saw these individuals on the mountain,” said Amy Bracewell, a spokeswoman for the National Park Service. “They got up next to Abraham Lincoln and unfurled the large banner,” she told AFP. “As soon as our people were mobilized we took down the banner and apprehended them and got them safely down the mountain.”

In this picture provided by the environmental group Greenpeace, Greenpeace climbers rappel down the face of Mount Rushmore National Memorial in Keystone, S.D. on Wednesday, July 8, 2009 to unfurl a banner that challenges President Obama to show leadership on global warming. Obama is at the G8 meeting in Italy to discuss the global warming crisis with other world leaders. A federal prosecutor says a dozen people were taken into custody on Wednesday after the incident. (AP Photo/Greenpeace, Kate Davison)
See how the environmentalists including the Mt. Rushmore protestors think that the stinking pile of manure that is Waxman-Markey Cap-and-Tax did not go far enough in this New York Times story.